Sinograms!
So first, why am I so excited about these that it is the banner of every page and is the first standalone page I am writing? Well, as I’ll hopefully be able to convey, these swirly abstract shapes contain a lot of really interesting math, are the basis for a lot of work I do day-to-day, and frankly I think they are art in their own right. It really embodies a lot of what I want this site to be about: cool engineering, and (my attempts at) art.
The basic principle
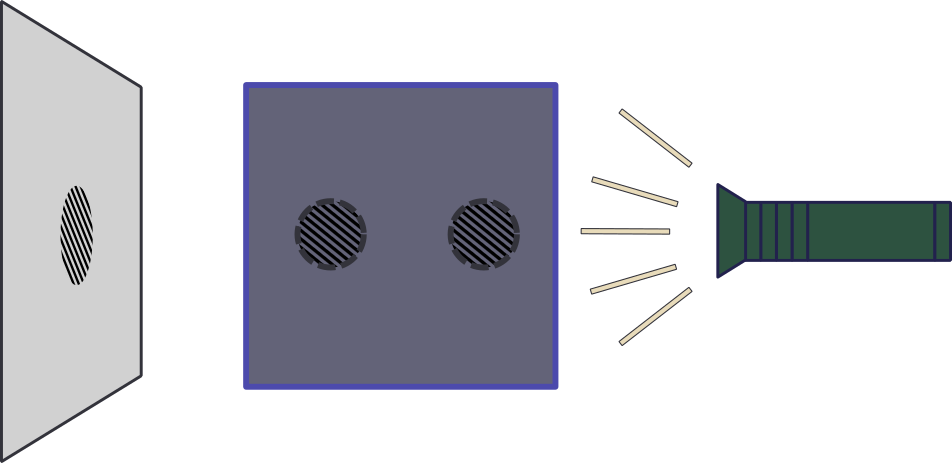
To me, the real interesting application of these sinograms to me is image reconstruction in medicine, though according to wikipedia there are a whole slew of them– like bar-code reading apparently? Think of the case of an unfortunate patient getting an X-ray after being shot in the abdomen. The doctor will clearly want to know where the bullet is lodged, and from the first front-to-back image they can tell if it is lodged on the left or right side of the person, but not how far forward or backwards it is. So the keen doctor thinks “I can take a second image from the side and see how far forward it is!” So they do, and take you into surgery and grab the bullet and you are miraculously healed. This is exactly the working principle behind CT; take numerous of X-Ray images from different angles, and put them together to build up an image. Another, less morbid case is a container that has two spheres in it that you can’t see into but for some reason a flashlight can penetrate it and make a shadow behind the box (or it is X-Rays and a x-ray sensitive plate behind it). In the case that the spheres are both along the flashlight’s center axis, there will be one dark shadow.
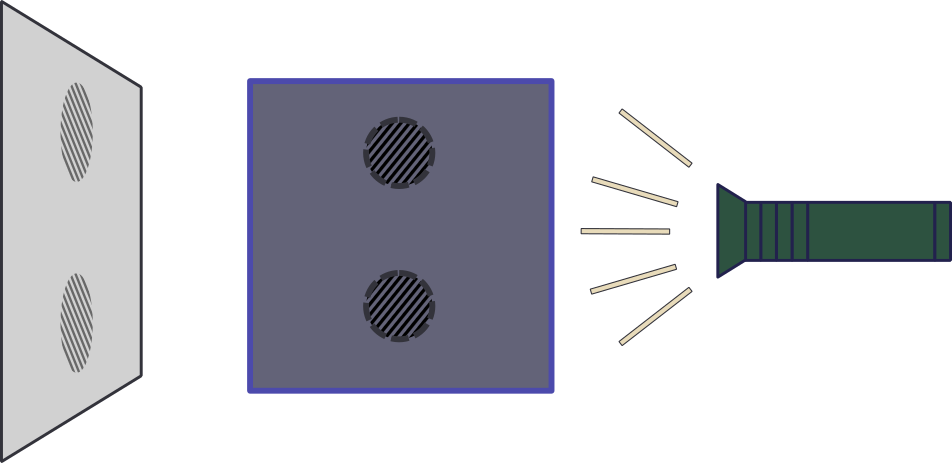
Now if you rotated the box 90 degrees and the spheres didn’t move, you would see two shadows. From these two shadows projected on the plane, you can deduce where the balls are located in the box.
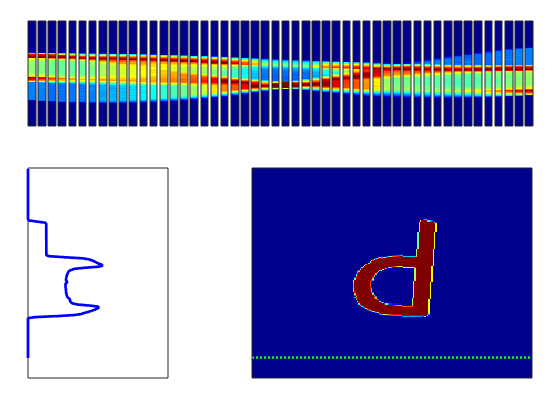
Magnetic Particle Imaging (MPI) works similarly (sometimes) except it doesn’t use X-Rays. Instead MPI uses magnets to move a sensitive line through the imaging region, and while the physics behind MPI are a topic for another time for now you can compare this sensitive line to the X-Ray beams in CT. In the first video below what you are seeing is an image in the bottom right (arbitrarily the letter P) have green line pass over it. This green line represents the sensitive line in MPI or the X-Rays (so the beam would go from right to left), and then the intensity of the pixels along the line are added together and plotted on the left. These values make up a “projection” because you are projecting a 2D image onto a single line. You will also notice that as the green line moves one of the columns on top starts filling in. The colors on top are just a different color-based representation of the data in any given projection. It is worth noting that the thickness of these columns is purely to make it easier to see– it doesn’t mean anything and it is a 1D data set. After the green line finishes the sweep of the image and the projection is complete the image rotates by a few degrees, and the process repeats. After the object has finished rotating a full 180 degrees the process is complete and the columns stacked next to each other is the sinogram! Script that made this is Here
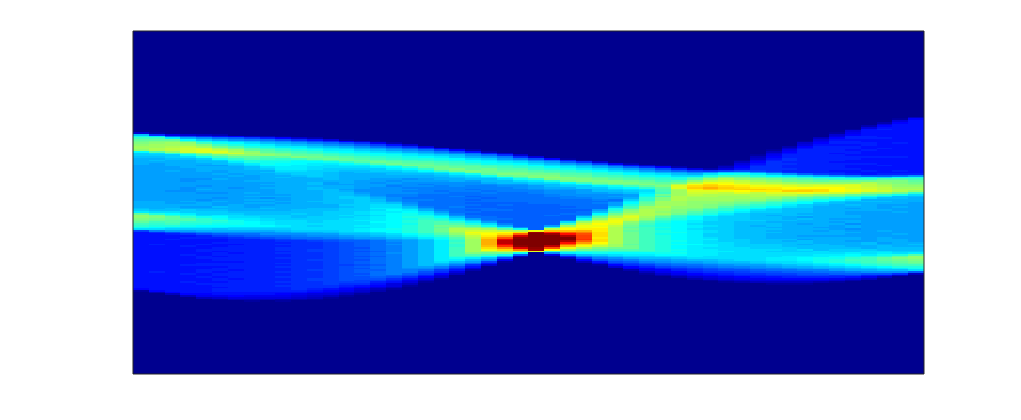
In that video the projections are rather far apart so the video would be done in a reasonable time. Here is the end result of a more finely discretized sinogram.
So, okay, we have a sinogram. What now? Well the information in that is sufficient to rebuild a representation of the original image. In a real-world case you would only have the raw data in the form of these projections/a sinogram and the goal would be to turn these data into an image of the inside of the original object you were looking at (e.g. a patient in a hospital, for instance). Below is a video of this, and what happens is that first you load one of the projections in the sinogram to the plot on the bottom left, and them you effectively smear it across the blank canvas on the bottom right. After this first operation, it doesn’t look very useful, but if you rotate the canvas by the same amount as before and smear the next projection across the canvas for each of the projections in the sinogram (taking the average of all of the layers), you start to see the original object come out. That, in brief, is projection reconstruction.
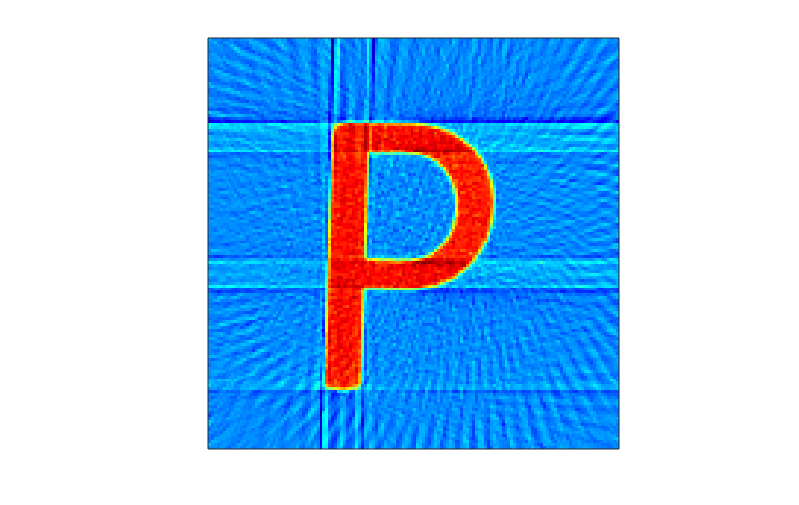
Here is the sinogram and reconstructed image from the finely discretized case:
With the background information out of the way, here are some pretty animations that were a lot of fun to make.